
Construction quantity tracking for data center mechanical, electrical, and plumbing (MEP) work measures installed quantities in the units each trade builds—linear feet of cable tray and pipe, counts of computer room air handler (CRAH) units and power distribution units (PDUs)—by zone and system.
Project managers then compare those counts to estimated quantities and to the install rate the schedule needs, which gives them a firm grasp of what’s in place and how fast each crew has to move. Because data center construction projects repeat the same hall design, your first hall also gives you a benchmark for every hall after it.
What is construction quantity tracking on data center construction projects?
Construction quantity tracking is the practice of counting actual quantities installed in the field and comparing them to the original plan, line by line. On a data center, you track each MEP system in its own unit of measure, zone by zone, across the halls and support spaces.
It sits between two familiar practices. Estimators produce a quantity takeoff in preconstruction to set the estimated quantities, and a foreman or project engineer judges percent complete on a walk. For assessing project progress, quantity tracking swaps that judgment for counts you can check against site imagery.
| Quantity takeoff | Percent complete | Construction quantity tracking | |
| When it happens | Preconstruction | During construction | During construction |
| Who owns it | Estimators | Foreman or project engineer | Project managers and project controls |
| What it’s based on | Drawings and the model | Judgment on a walk | Counts of installed work, checked against site imagery |
| Where it’s most useful | Budget and bid | Quick status updates | Pay applications and earned value |
Think of quantity tracking as the counting layer of a broader construction progress monitoring practice: the schedule says what should be done, and installed quantities show how much is in place.
Why does percent complete hide MEP risk from project managers?
Percent complete hides MEP risk because MEP effort doesn’t move in a straight line, so one number can’t show which part of a scope is done. Data centers rank among the most complex projects in the construction industry, and the MEP scopes hold most of that complexity.
A crew can hang most of the cable tray in a data hall in a few weeks, then spend longer on cable pulls and terminations than the tray took to set. Report that scope as 70 percent complete and the number looks healthy right up until terminations stall.
Scarce labor raises the cost of that gap. In the Turner & Townsend Data Centre Construction Cost Index 2026–27, 81 percent of respondents say skilled labor in their region is constrained, and the report names MEP trades as the most sought-after. With crews that hard to find, effective resource management depends on knowing where the work stands.
A soft progress number can lead a project manager to send the scarcest people on-site to the wrong hall. Crews then recover late by compressing the remaining work, and compressed MEP work tends to lower project quality.
Once you count installed quantities by system, you can see which scope is behind and by how much, while there’s still time to course correct.
“The first gap shows up in the scopes that look finished from the floor. Overhead tray and pipe go up fast, so percent complete climbs early, while the count of what’s supported and connected trails behind it. Nobody is padding the number. A foreman looks at a ceiling full of tray and reports what they see. Once you count components, the difference shows up in the first update, and it matters beyond the GC. Owners and lenders release money against that number.”
—Michaela Rhile, Product Manager, OpenSpace
How to choose the right unit for installed quantities on each MEP system
Accurate tracking starts before anyone counts: agree with the trade on what to count and what counts as installed. Settle it as part of your pay application process, before the first one goes out.
| MEP system | Unit | Counts as installed when | Visual verification |
| Cable tray and ladder rack | Linear feet | Hung and supported, with bonding complete in the zone | Strong until ceiling or containment closes |
| Busway | Linear feet, plus plug-in units by count | Sections joined and supported; plug-ins counted on their own | Strong |
| Chilled water and cooling distribution piping | Linear feet by pipe size | Installed and supported; pressure tests tracked on their own | Strong before insulation and close-in |
| Conduit and wire | Linear feet of conduit; wire by completed pull | Conduit by run; wire when the pull is complete | Conduit visible; wire often concealed |
| CRAH units, computer room air conditioners (CRACs), and coolant distribution units (CDUs) | Each | Credit by stage, from set to ready for test | Set and connected visible; test status lives in commissioning records |
| PDUs and remote power panels | Each | Set, then terminated | Set visible; terminations need close-up capture |
| Sprinkler mains and heads | Linear feet for mains; heads by count | Installed in the zone | Strong before ceiling |
Set rules of credit for staged equipment
Staged equipment needs the tightest rules. Give CRAH units and PDUs partial credit at each stage, from set through ready for test, so a unit sitting on its concrete housekeeping pad earns credit for being set and nothing more. In liquid-cooled halls, add the secondary piping in the white space as its own line.
Foremen often log daily production on time cards or daily reports. Site imagery gives project managers a way to check those numbers before they reach a pay application.
How to build a zone-by-system matrix for project monitoring
Put zones down the side and systems across the top. In each cell, record installed quantities against estimated quantities, for example, “Hall 2, cable tray, 3,100 of 4,800 linear feet (LF).” Project teams can then see in one view which system is lagging and in which zone.
Illustrative example, installed vs. estimated quantities:
| Zone | Cable tray (LF) | Busway (LF) | Chilled water piping (LF) | CRAH units set |
| Hall 1 | 4,800 of 4,800 | 1,200 of 1,200 | 3,600 of 3,600 | 12 of 12 |
| Hall 2 | 3,100 of 4,800 | 900 of 1,200 | 2,700 of 3,600 | 10 of 12 |
| Hall 3 | 1,800 of 4,800 | 300 of 1,200 | 1,100 of 3,600 | 4 of 12 |
Match the zones to your work packages
Match the zones to the way the job is already packaged. Construction Industry Institute research on Advanced Work Packaging splits a project into construction work areas, then into smaller installation work packages for crews. If your quantity zones mirror those areas, field crews and office staff read progress against the same boundaries the schedule uses.
Use the first data hall as the benchmark for every hall after it
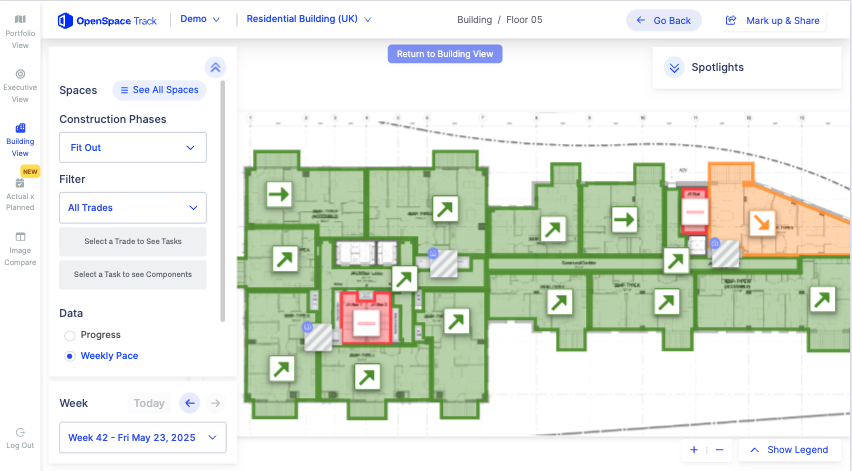
Data center campuses repeat themselves. Halls and electrical rooms often share one design, which gives builders an internal yardstick most building types lack.
If you track production in the first hall week by week, you end up with a productivity curve for that crew and that design. Halls two through six should follow a similar curve, and you’ll see a hall drifting off it weeks before the schedule update shows the slip.
Hall one also gives you a material usage baseline. If that crew consumed tray and fittings close to plan, later crews should too. A hall drawing more material than its installed quantities explains waste or rework somewhere in the zone, and catching it in hall two helps minimize waste in the halls still to come.
“On a repeated design, the first hall teaches you how that crew builds that room, and most teams use the lesson once. When I worked summers on my family’s jobsites, I never saw anyone compare week four in one building with week four in the next. With a counted curve from the first hall, a trade drifting off pace shows up within a couple of updates. The schedule tends to tell you after the float is gone.”
—Michaela Rhile, Product Manager, OpenSpace
Turn installed quantities into a required install rate
The math takes four steps:
- Pull the remaining quantity for the scope from the matrix.
- Count the weeks left before that scope has to be complete.
- Divide the remaining quantity by the weeks left to get the weekly production the crew must hold.
- Compare that required rate with the actual amounts the crew installs each week and with hall one at the same stage.
Illustrative example, cable tray in hall three:
| Measure | Value |
| Estimated quantity | 4,800 LF |
| Installed to date | 1,800 LF |
| Weeks until tray must be finished for cable pulls | 6 |
| Required rate | 500 LF a week |
| Actual rate | 380 LF a week |
| Hall 1 at the same stage | About 520 LF a week |
You can spot that 120-foot weekly gap in week two, with time left to add a crew or pull material forward.
See install rates for every hall. Verified installed quantities by zone and system, from every site walk. Get a demo.
Where do verified quantities pay off on project costs & disputes?
Verified quantities pay off in two places: material deliveries and disputes over billed work.
Material tracking work that matches material quantities to the install rate
U.S. Engineering, a mechanical contractor founded in 1893, uses OpenSpace Track to generate percent-complete figures for sheet metal installation. The team uses those figures to support monthly pay applications.
Project Manager Aaron Denning also uses them to forecast how much sheet metal to deliver next, so material doesn’t sit in on-site storage for weeks. Matching materials delivered to the pace of installation prevents over-ordering, helps reduce waste, and protects profit margins, which matters on data center construction sites with tight laydown space.
Digital records that hold up in a dispute
A count holds up better when you can link it to time-stamped imagery. Sweet Projects, a UK builder delivering data centers, moved its Longcross project from weekly to daily captures with OpenSpace Capture, sometimes capturing twice a day. The team uses OpenSpace to monitor site progress in real time. Project Director Andrew Moss says of the record: “It can’t be tampered with, which makes things easier if there’s a contractual argument.”
With construction progress tracking software that verifies work-in-place from site imagery, each quantity stays tied to its image and its schedule task. If someone questions a pay item or change order, the team pulls up the date and location instead of arguing from memory.
How does OpenSpace verify MEP installed quantities for field teams?
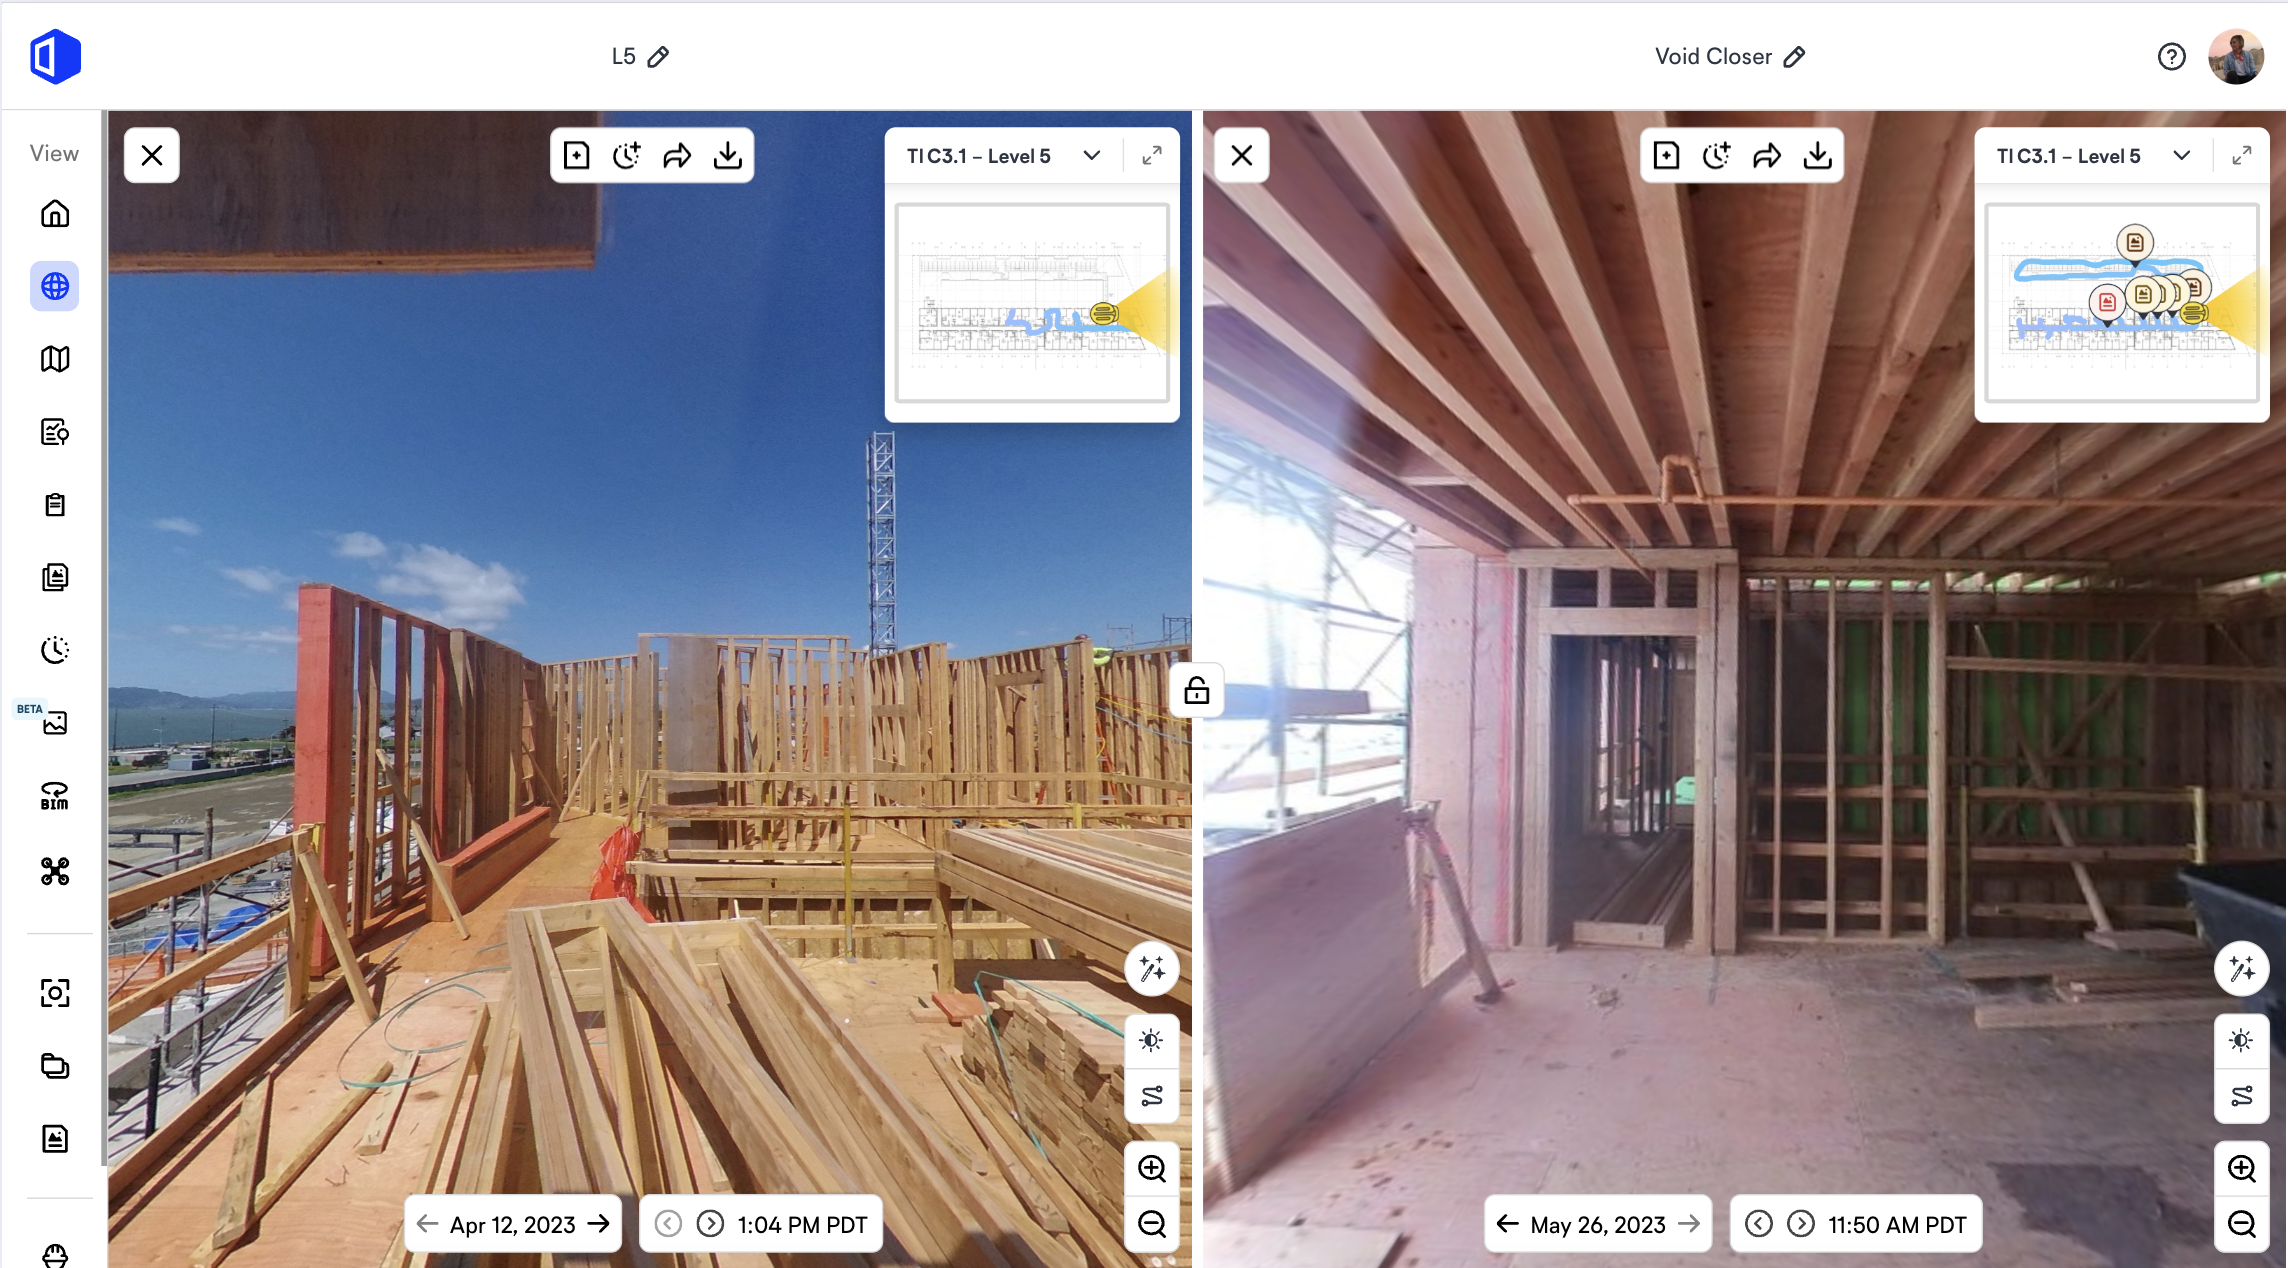
OpenSpace, the Visual Intelligence Platform for builders, turns the walks field teams already make into verified counts. On a data center, the workflow looks like this:
- Field teams capture the site with smartphones or 360° cameras on their normal walks, and the Spatial AI engine pins every image to the floor plan by location and date.
- OpenSpace Track covers more than 700 visual components across 200-plus schedule tasks, including MEP scopes, and pairs AI tracking with human review before reporting progress.
- OpenSpace Track pushes results to P6, Asta Powerproject, Microsoft Project, or Excel, which saves time on manual data entry.
- Spotlights flag unfinished work and blockers before they turn into rework.
- BIM Compare places installed tray or pipe beside the design for runs that need a model check.
Linxon is a joint venture of AtkinsRéalis and Hitachi Energy whose work includes power for data centers. Manikandan Rangasamy, Head of Planning AMEA at Linxon, says planners no longer have to chase people for progress updates.
“When installed runs and the model disagree, the count is seldom the problem. The model shows design intent, and the field resolves conflicts the model never saw. A tray run shifts a few feet to clear a duct, or a pipe picks up an extra offset. Each of those is a sensible field decision. The trouble starts when the decision never travels back to the office, because then the model and the pay application end up describing different buildings. Comparing captures to the model tells you which version is real.”
—Molly Taylor, Product Manager, OpenSpace
Bring verified counts to your next data center. Map your MEP scopes and rules of credit with an expert.
Frequently asked questions
How often should construction quantity tracking be updated on a data center?
Weekly updates work for most MEP scopes. Move to daily captures in zones about to close in, since tray and piping above ceilings or inside containment become hard to count once covered.
Can QR codes handle material tracking on data center projects?
Partly. QR code technology handles delivery and location tracking well, including prefabricated skids and long-lead equipment. Installed status still needs a count verified from site imagery or a field walk.
How should change orders be handled in construction quantity tracking?
Add change order quantities as separate line items against the affected zone and system, and keep the original plan quantities intact. That separates added scope from lost production when project managers price the change.
Do daily reports still matter once quantities are tracked from site imagery?
Yes, daily reports still capture crew size, time cards, weather, delays, and equipment on-site. Paired with verified installed quantities, they help pinpoint inefficiencies when labor hours rise and output doesn’t.
Count it before you bill it
Installed quantities cover only the first state of the work. Energization and testing come later through commissioning, which is why tracking data center construction progress works best when you report each state on its own.
Start with the unit for each system and the rules of credit, then build the zone-by-system matrix and let hall one set the pace for the halls that follow. With installed quantities verified against site imagery, project managers can stay ahead of slips and point resources at the scope that needs them before they bill.
Know what’s installed before you bill for it. Track data center MEP progress by quantity, from the first hall to the last. Get a demo now.