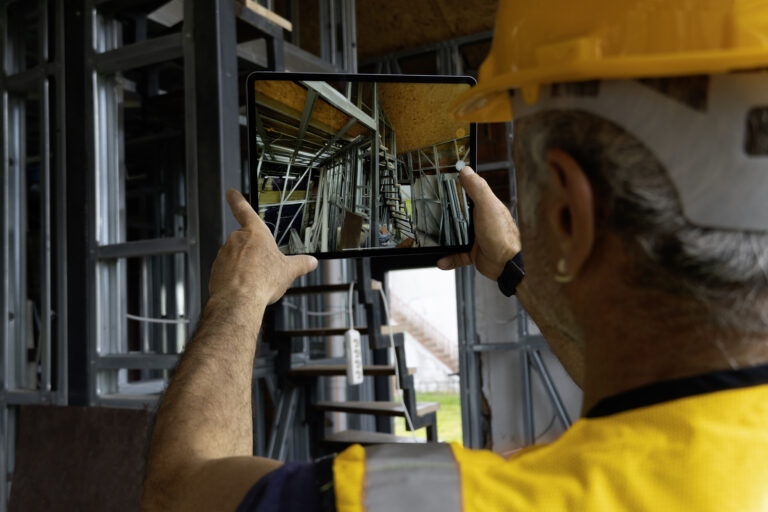
Percent-complete construction reporting is only as reliable as the evidence behind it. A project that reports 60 percent complete is making a claim, and until something confirms that claim against the site, it stays a claim.
The measurement itself is sound. What breaks is the habit of accepting a self-reported percentage, then letting it determine revenue, payment, and schedule decisions across the entire project.
Verified against captured reality, percent complete becomes one of the most useful measurements a construction business has. Unverified, it quietly moves risk downstream.
Why does spend get mistaken for progress in the construction industry?
Spend gets mistaken for progress because money is the easiest quantity on a construction project to count. Every hour lands on a timesheet and every dollar posts to an accounting system whether anyone walks the floor or not. Work performed leaves no equivalent trail. Somebody has to go look at it, determine what counts as finished, and write a percentage down.
So the construction industry substitutes. Costs become the proxy for progress because costs are already measured, and the substitution holds until it doesn’t. A crew burns $50,000 on a change order, and the cost report credits $50,000 of progress.
What the owner received might be $50,000 of installed work. It might also be $30,000 of installed work plus rework, waiting, and a mobilization that produced nothing. The costs incurred are real either way. The work completed is the part nobody measured.
On long-term projects, that gap is where most bad decisions begin.
How the percentage of completion method turns percent complete into revenue
The percentage of completion method lets a contractor recognize revenue as work progresses rather than waiting for handover, and percent complete is the input that drives it.
Under generally accepted accounting principles and international financial reporting standards, long-term contracts use this accounting method because deferring all revenue to the end would misrepresent a company’s financial health for years. The completed contract method does exactly that, surviving mainly for shorter jobs and small contractors where the distortion stays tolerable.
How the cost-to-cost calculation works
Most contractors determine the percentage using cost-to-cost:
- Divide costs incurred to date by total estimated costs.
- Multiply that ratio by the total contract price to get total revenue recognized to date.
- Record revenue for the difference between that result and the prior period.
The journal entries flow onto the balance sheet from there. Remaining costs get re-estimated every period, and the percentage moves with them.
Why the calculation inherits a field estimate
Read the formula closely, and its assumption becomes visible. Cost-to-cost treats expenses as a stand-in for work performed. It is precise arithmetic performed on an estimate, and that estimate is a field judgment about how much of one project is finished.
When total estimated costs shift, or the field measurement runs optimistic, the accounting is flawless, and the answer is still wrong. Every downstream process, from the pay application to the balance sheet, inherits that error without seeing it.
Which progress measurement method is behind the number?
Most projects use one of six progress measurement methods, and they are not equally reliable.
| Method | What it counts | Where it breaks |
| Units completed | Physical quantities installed | Only works on repetitive, countable scope |
| Cost ratio | Costs incurred against budget | Assumes money spent equals work installed |
| Weighted milestones | Credit released at checkpoints | Progress stalls invisibly between milestones |
| Start-finish (0-50-100) | Fixed credit at start and at finish | Arbitrary for anything mid-flight |
| Level of effort | Time elapsed | Measures duration, not output |
| Physical percent complete | A supervisor’s judgement | Only as reliable as the person estimating |
Only units completed produce a hard count. The other five estimate or infer, and cost ratio infers from the one quantity least connected to what is standing on site.
Progress is a position. Productivity is a rate.
Progress answers where a project stands. Productivity answers what it costs to get there. Two crews can both report 40 percent complete on identical scope, and one can be making money while the other burns it. The percentage alone will never tell them apart.
| Progress | Productivity | |
| Answers | Where the project stands | What it cost to get there |
| Built from | Work installed against scope | Work installed against resources spent |
| Breaks when | The percentage is self-reported | Either term is estimated |
| Shows up in | Pay applications, schedule updates | Crew performance, future projects |
The construction industry has no external benchmark that closes this gap. The Bureau of Labor Statistics publishes construction productivity measures for only four construction industries, and its detailed labor hours measures exclude work performed by subcontractors, because those services count as purchased inputs. That data serves economists, not a superintendent who needs to determine whether last week’s drywall crew beat the estimate.
Measuring construction productivity has to happen one project at a time, from that project’s own record.
“Nobody sets out to misreport. The person filling in the number is estimating the scope they have partially touched, and partially touched rounds up. I spent summers on my family’s crew, and a room felt done to us long before it was done for the owner. Multiply that honest optimism across every trade on a floor and you get a percentage nobody can point to a source for.”
—Michaela Rhile, Product Manager, OpenSpace
How do you calculate real construction productivity?
Real construction productivity is verified work installed divided by resources spent. The denominator is never the problem. Labor hours come off timesheets, equipment costs come off rental agreements, and material expenses come off purchase orders, all of it recorded automatically by tools built to protect cash.
The numerator is the problem. Work installed is the only term in the equation that gets estimated rather than measured, estimated by people under schedule pressure with every incentive to round up. The pattern is old enough to have a name in the earned value literature, where a work package sits at 90 percent done week after week until the project manager stops believing it. Feed an estimate into the top of a ratio and the output is an estimate with a decimal point on it.
Fix the numerator and everything downstream sharpens. Productivity becomes comparable week over week and crew over crew. Estimates for future projects get calibrated against what happened rather than what was reported. The same verified measurement that determines productivity feeds the cost-to-cost calculation, so one measurement improves the operations view and the revenue view together.
Why a field estimate ends up inside the financial system
Michael Fleischman, CTO and co-founder of OpenSpace, describes the construction technology stack as three connected pillars: the field system, the financial system, and the project management system. The value of visual data in that framing is that it auto-verifies work in place, so pay applications move faster and contractors get paid sooner.
That is the whole mechanism in two sentences. A percentage written down on a floor travels into the schedule of values, into the pay application, and onto the balance sheet, usually without anyone re-examining where it came from. The field system and the financial system are connected whether or not the number passing between them has been checked.
Where the gap shows up: change orders, billing & schedule surprises
Two parties reading different evidence about the same work is how disputes start. Billd’s 2026 National Subcontractor Market Report found subcontractors wait an average of 51 days to be paid after submitting a pay application, while general contractors estimate payment goes out in 35. Neither business is lying. They count from different events, and nobody owns the difference. For specialty trade contractors, that difference is working capital.
Percent complete produces the same shape of problem earlier in the chain. A trade bills against a schedule of values, a project manager questions the percentage, and the review cycle absorbs days the calculation never needed. Change orders sharpen it, because a change order adds costs to the contract before it adds anything visible to the building, and cost-to-cost credits progress the moment the money moves.
Schedule surprises arrive the same way. By the time variance is too large to absorb, the recovery options are the expensive ones. Vito Antuofermo, Vice President at Commodore Construction, described his team being unaware of significant delays and cost overruns until a project reached 50 percent completion. With automated tracking running, productivity problems surfaced as early as 10 percent completion.
“The reported curve and the verified curve start separating well before anyone files an invoice. Reported progress climbs at a steady rate because that is what the schedule expects of it, and verified progress moves in steps because that is how work actually lands. When those two lines stay apart across a couple of captures, you are looking at next month’s dispute a month early. Everywhere else that money moves against reported performance, somebody is paid to watch that gap. Construction mostly is not.”
—Michaela Rhile, Product Manager, OpenSpace
What a verification-first project management workflow looks like
A verification-first workflow changes one thing. The percentage stops being an opinion and becomes an observation:
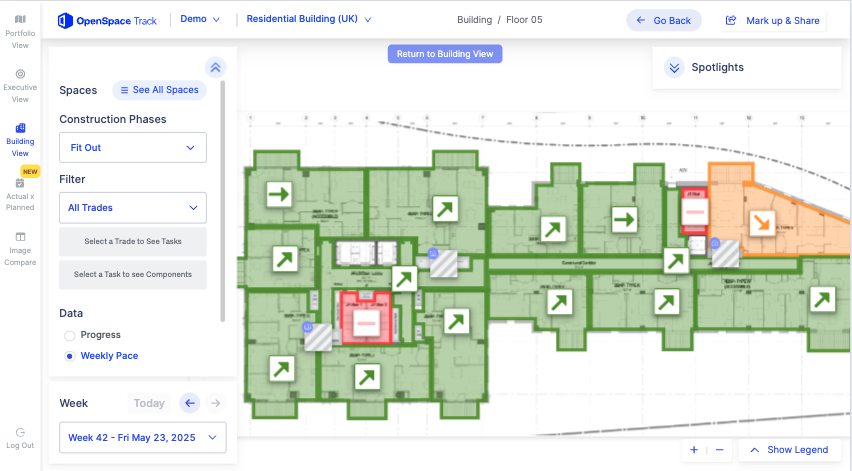
- Capture. The site gets recorded on a fixed cadence during a walk somebody was already doing.
- Locate. Imagery maps to plans automatically, and visual components map to schedule tasks.
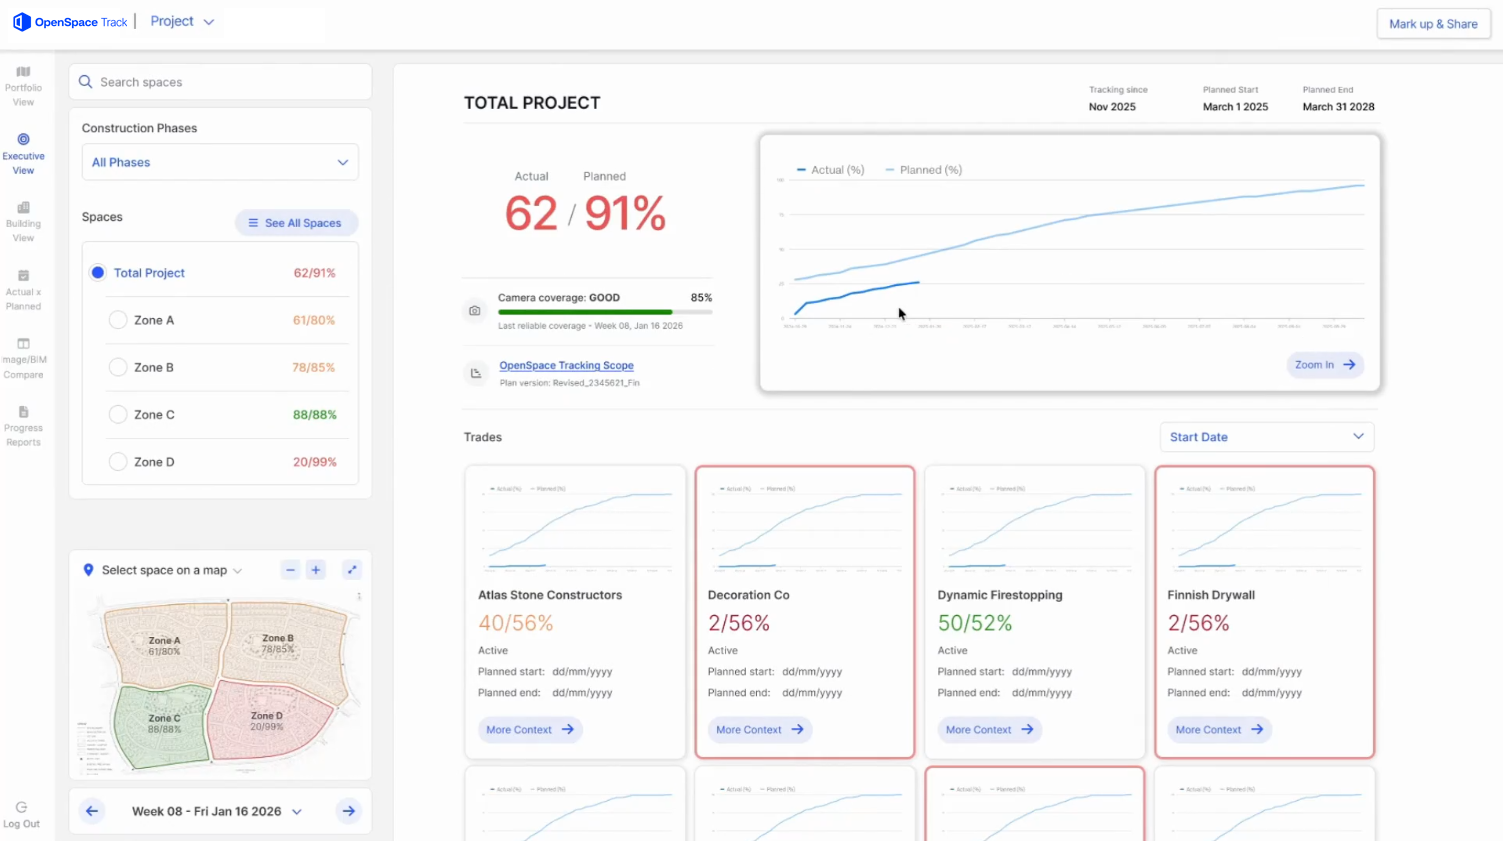
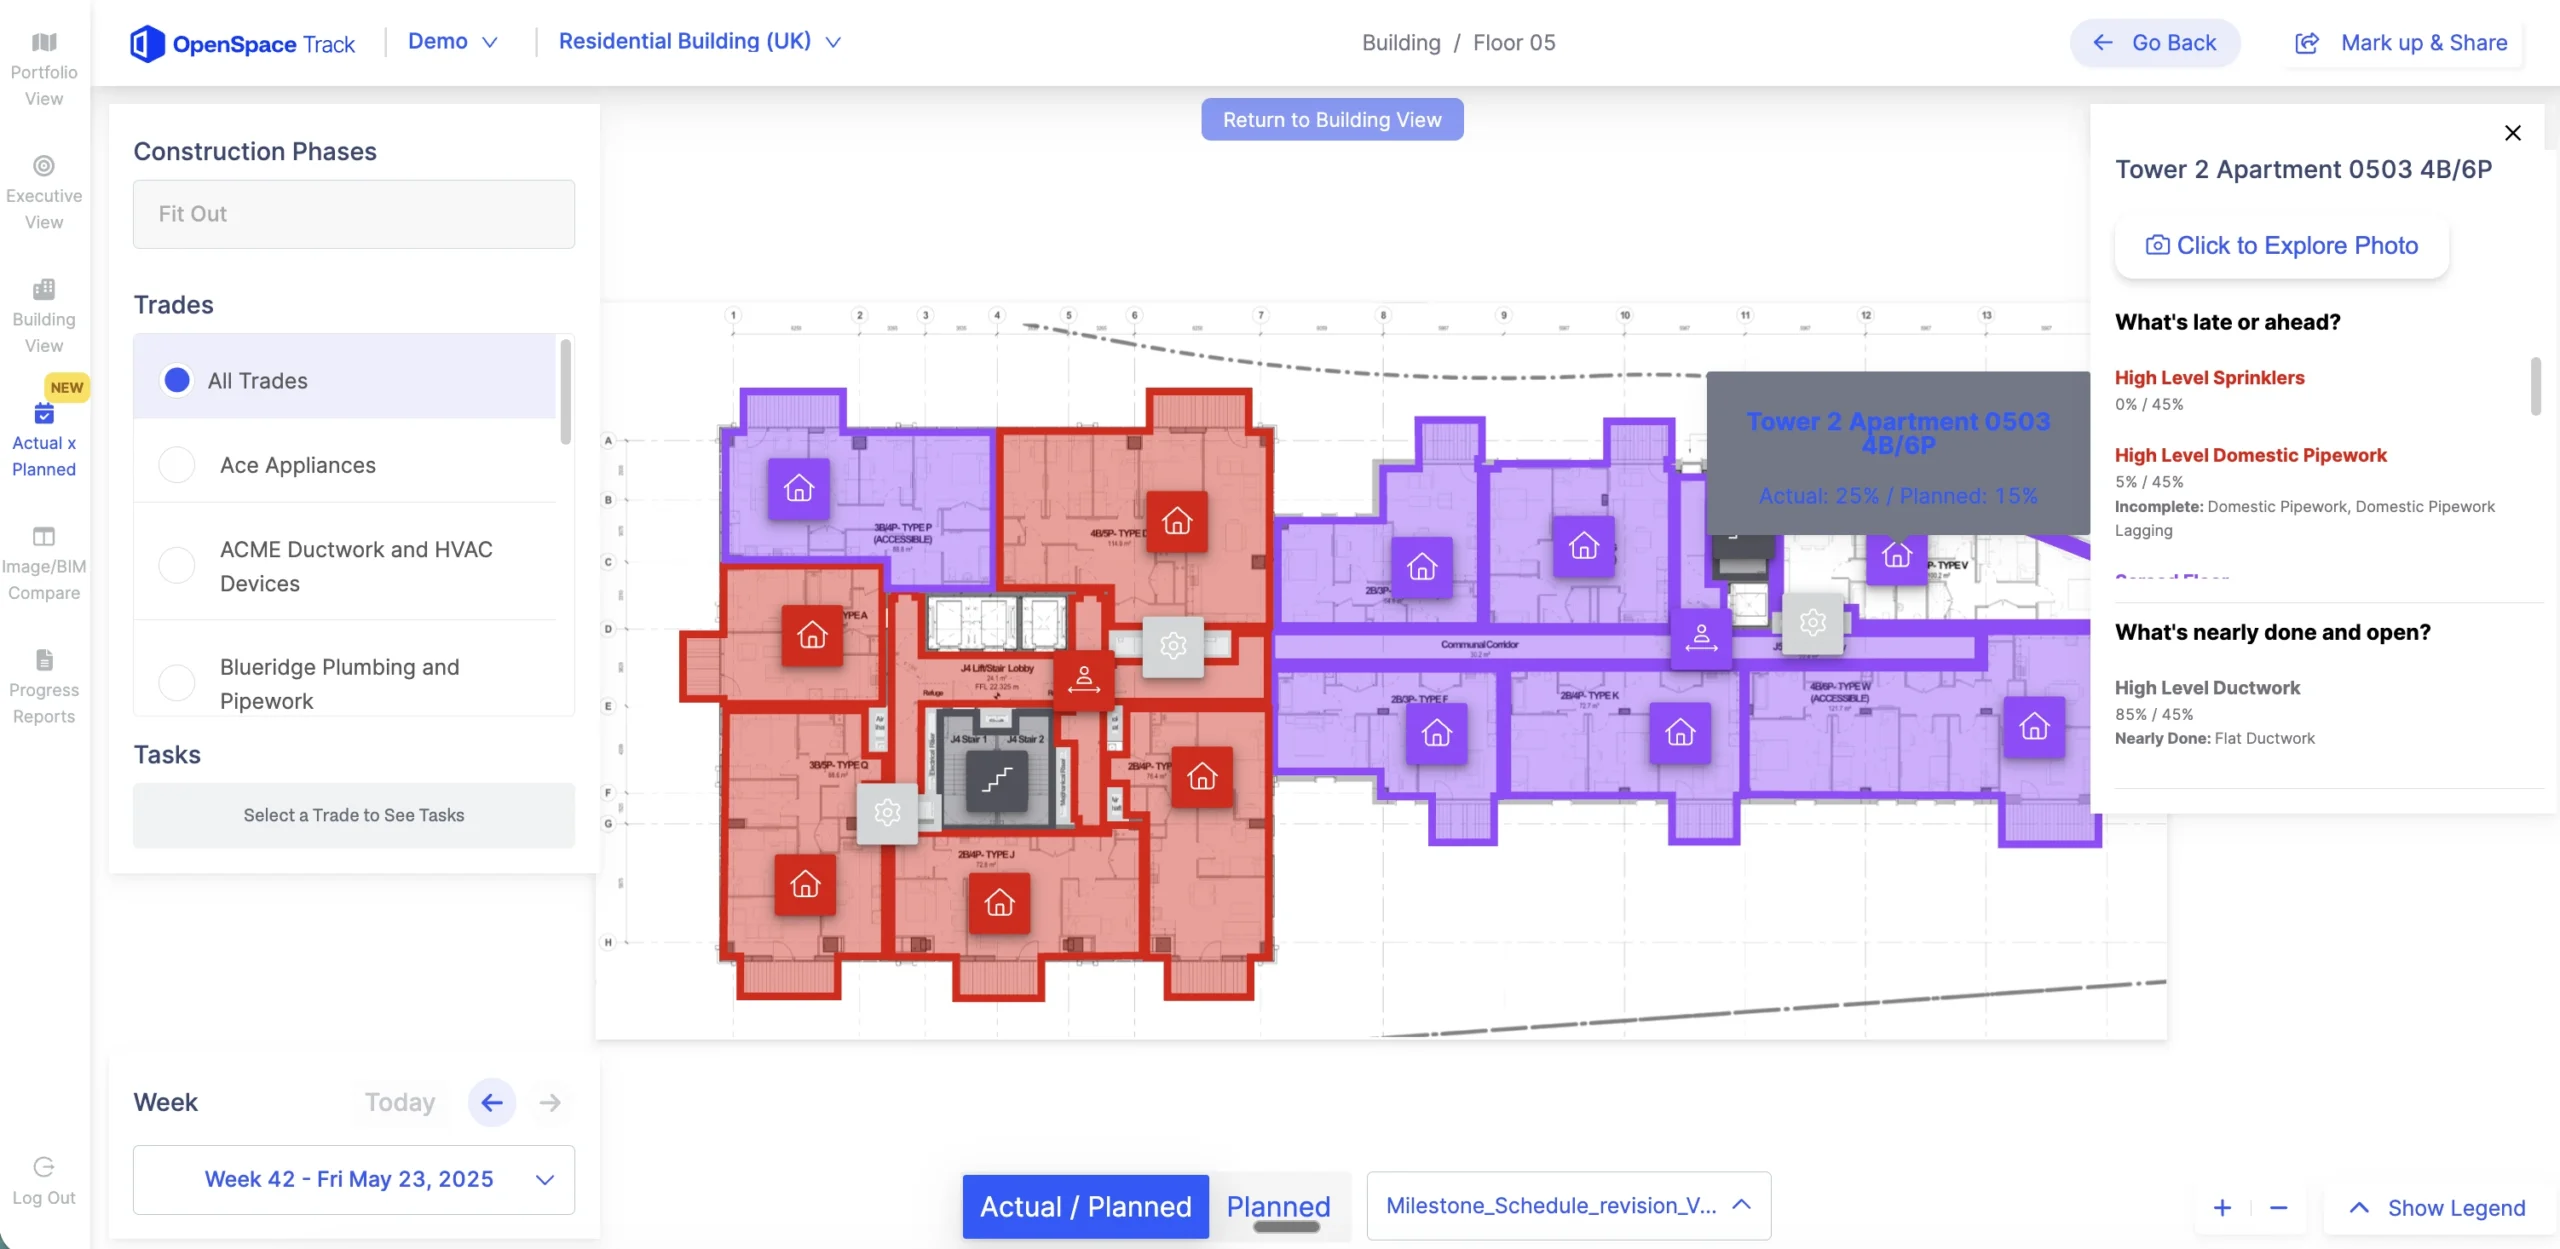
- Verify. Analysis returns percent complete by trade, floor, and zone.
- Report. The verified percentage reaches the schedule and the pay application together.
OpenSpace Track runs that process across 700 visual components in more than 200 schedule tasks, pairing AI classification with expert human review rather than trusting either alone.
In practice that means reporting how much drywall has been hung and how much has been taped, as percentages or material quantities, measured against the schedule. Results push into scheduling tools including P6, Asta Powerproject, Microsoft Project, and Excel, so accurate data lands in the schedule the project runs on.
That combination makes construction progress tracking software defensible for billing rather than merely informative, and it strengthens every calculation built on percent complete, including earned value management calculations.
See what verified percent complete looks like on your project. Request a demo.
What changes when percent complete is verified?
Verified percent complete changes what a project can prove, and the evidence is specific.
At RG Construction, a Chicago drywall contractor, Senior Estimator and Project Manager Adam Bessert found on his first OpenSpace project that hours spent on part of the partition framing ran well above what the estimate anticipated. He traced it to how his crew was using a piece of equipment. Without the verified record, he has said, the problem might not have surfaced until the entire floor was framed. Progress looked fine throughout. Productivity did not.
Suffolk applied the same approach on the Estates at Acqualina, two 827,000 square foot towers, producing verified percent complete values for drywall, framing, insulation, and sheetrock. BESIX Watpac used its visual record to hold subcontractor accountability conversations against evidence, not recollection.
None of these builders abandoned percent complete. They kept the measurement and replaced its input.
“The debate about whether the work is in place ends. Everyone opens the same capture and looks at the same wall. What comes next is a harder and more useful question, which is why a crew that was supposed to finish a floor in three weeks took five. Verification does not answer that one. It makes it the question on the table instead of a footnote nobody has time to chase.”
—Michaela Rhile, Product Manager, OpenSpace
Frequently asked questions
How often should a site be captured to keep percent complete current?
Capture cadence should match how fast the work changes, which on most active construction projects means weekly. Trades moving quickly through repetitive scope benefit from twice-weekly capture. A capture covering 25,000 square feet takes about 10 minutes, so cadence is rarely limited by effort.
Does verified progress tracking require a BIM model?
No. OpenSpace Track deploys on any project with no BIM required, working directly from 360 degree captures and drawings. Where a model does exist, it can be incorporated to sharpen alignment and analysis.
What is the difference between percent complete & earned value?
Percent complete measures how much of the scope is finished. Earned value converts that percentage into dollars against the budget, which makes it entirely dependent on the accuracy of the percentage feeding it. An unverified percent complete produces an earned value figure that looks rigorous and is not.
Who should own the percent complete measurement on a project?
Ownership sits with whoever bills against it, so the trade proposes the percentage and the general contractor approves it. That arrangement puts the party with the most incentive to round up in charge of the estimate. Verification does not remove the owner of the measurement; it gives everyone else something to assess it against.
Talk to an OpenSpace expert about grounding percent complete in verified progress. Request a demo.