
The most useful data center statistics for builders in 2026 come down to five numbers. The global data center construction market reached $239.0 billion in 2025. A modern greenfield facility now averages $17.6 million per megawatt (MW) to develop.
North America’s primary markets have a record 7,481 MW under construction, and vacancy in those markets sits at 1.4 percent. More than half of projects in 2025 ran at least three months late.
Every figure on this page links to its original source and carries a date, so you can find one number and cite it in seconds. Rising demand from AI workloads and cloud computing is pushing developers to build faster than utilities can connect sites and suppliers can ship equipment. That gap shows up in almost every statistic below.
How big is the data center construction market?
The global data center construction market size stood at $239.0 billion in 2025 and should reach $428.0 billion by 2035, a 6.0 percent compound annual growth rate, according to Future Market Insights’ data center construction market report. Electrical infrastructure makes up 52.1 percent of that 2025 market.
Spending in the United States is growing much faster than the global average. Private data center construction put in place reached a seasonally adjusted annual rate of $84.95 billion in August 2026 (preliminary), up 73.2 percent from $49.05 billion a year earlier, per the U.S. Census Bureau’s private construction spending table.
The development pipeline behind those figures is larger still. Cushman & Wakefield’s 2026 Data Center Development Cost Guide puts it at $2.3 trillion, with $492 billion of that under construction today. Looking further out, McKinsey expects data center capital expenditures, excluding IT hardware, to exceed $1.7 trillion by 2030. McKinsey also reports that hyperscalers, the key players behind this demand, expect to spend $300 billion in 2025.
| Market statistic | Figure | Source, date |
| Global market size | $239.0B (2025) → $428.0B (2035) | FMI, 2025 |
| Global growth rate | 6.0% CAGR | FMI, 2025 |
| U.S. private construction spending | $84.95B SAAR, +73.2% YoY | U.S. Census Bureau, Aug 2026 |
| Development pipeline | $2.3T total, $492B under construction | Cushman & Wakefield, 2026 |
| Capex outside IT hardware | >$1.7T by 2030 | McKinsey, 2025 |
| Hyperscaler capex | $300B (2025) | McKinsey, 2025 |
FMI sizes the global market, while Census tracks U.S. construction work put in place, so the two figures don’t compare one to one when you cite these data center statistics.
How much does data center development cost?
Data center construction costs now average $17.6 million per MW for the most modern greenfield facilities, up 21 percent per MW since Cushman & Wakefield’s previous edition in Q4 2024. Turner & Townsend’s Data Centre Construction Cost Index 2026–27 puts the U.S. country average at $12.08 per watt. Tokyo is the most expensive market at $18.28 per watt, and U.S. facilities built for AI workloads cost about 10 percent more than standard builds.
Power infrastructure & land costs
Power infrastructure is the biggest single line in the budget. Cushman & Wakefield’s release announcing the 2026 guide names power infrastructure as the largest cost category, averaging about 21 percent of greenfield development costs.
Power costs show up before construction starts: Powered land in primary U.S. markets averaged $584,000 per MW in 2026, and Texas markets still rank among the lowest-cost development environments in the country.
| Cost statistic | Figure | Source, date |
| Average greenfield cost | $17.6M per MW | Cushman & Wakefield, 2026 |
| Cost change since Q4 2024 | +21% per MW | Cushman & Wakefield, 2026 |
| U.S. average cost per watt | $12.08 | Turner & Townsend, 2026–27 |
| AI-workload premium (U.S.) | ~10% | Turner & Townsend, 2026–27 |
| Power infrastructure share | ~21% of total cost | Cushman & Wakefield, 2026 |
| Powered land, primary U.S. markets | $584,000 per MW | Cushman & Wakefield, 2026 |
Estimated value of capacity under construction
Multiply the 7,481 MW under construction in primary markets by $17.6 million per MW and you get about $132 billion of work in place. Treat that as an order-of-magnitude estimate, since the cost guide average applies to the most modern facilities.
How long does data center construction take?
Data center construction now takes years before the first server goes live: McKinsey puts the time between a request for services and the start of construction at 12 to 36 months, a window that spans early work such as site selection and permitting.
Grid access stretches timelines most. JLL’s 2026 global data center outlook reports average grid connection lead times of more than four years in primary markets. JLL’s midyear 2026 North America report adds that most tenants signing leases today are contracting for 2028 deliveries.
| Timeline statistic | Figure | Source, date |
| Request for services to construction start | 12–36 months | McKinsey, 2025 |
| Grid connection lead time, primary markets | >4 years | JLL, Jan 2026 |
| Typical delivery year for leases signed today | 2028 | JLL, midyear 2026 |
“Data center schedules slip through small misses, like a cable tray run that’s behind on one level or a data hall that isn’t ready for racks. Those misses sit in the field until someone walks that area or the next update comes due. The gap between when work falls behind and when the team knows about it is where float disappears. When you capture the site on a regular cadence and compare it against the schedule, that gap shrinks to the time between captures, and the team still has room to resequence.”
— Michaela Rhile, Product Manager, OpenSpace
How often are data center construction projects delayed?
More than half of data center projects in 2025 experienced construction delays of three months or longer, according to JLL. The same outlook puts the average global equipment lead time at 33 weeks, 50 percent longer than before 2020.
Power is the constraint builders name most. In Turner & Townsend’s 2025–26 survey, 48 percent of respondents said power availability is the biggest obstacle to delivering on schedule, and 83 percent said local supply chains are not ready for advanced cooling. Transformer supply helps explain the wait. Average power transformer lead times rose from about 50 weeks in 2021 to 120 weeks in 2024, per Wood Mackenzie.
| Delay statistic | Figure | Source, date |
| Projects delayed 3+ months | >50% | JLL, Jan 2026 |
| Average equipment lead time | 33 weeks | JLL, Jan 2026 |
| Power named top schedule obstacle | 48% of respondents | Turner & Townsend, 2025–26 |
| Power transformer lead time | ~120 weeks (2024) | Wood Mackenzie, 2024 |
Why power drives data center schedule risk
Set these numbers against the cost data and you see a mismatch. Power infrastructure is about a fifth of total cost, but it is the item builders most often name as the threat to their delivery date. A late transformer or a slipped energization date can leave a finished building waiting, and the owner’s revenue waits with it. For a wider view across project types, see OpenSpace’s construction project delay statistics.
“When the utility date is fixed, the team has to work out what it can finish before power arrives. Site work and later-phase shells often have room to move, but you only see that room when you know where each area stands. Aerial captures give you the whole campus in one view, so you can see which pads are ready and which are waiting. Ground captures inside the buildings tell you whether a room can take equipment the day it lands. With both, the team can sequence work around the long-lead dates.”
— Jess Lam, Product Manager, OpenSpace
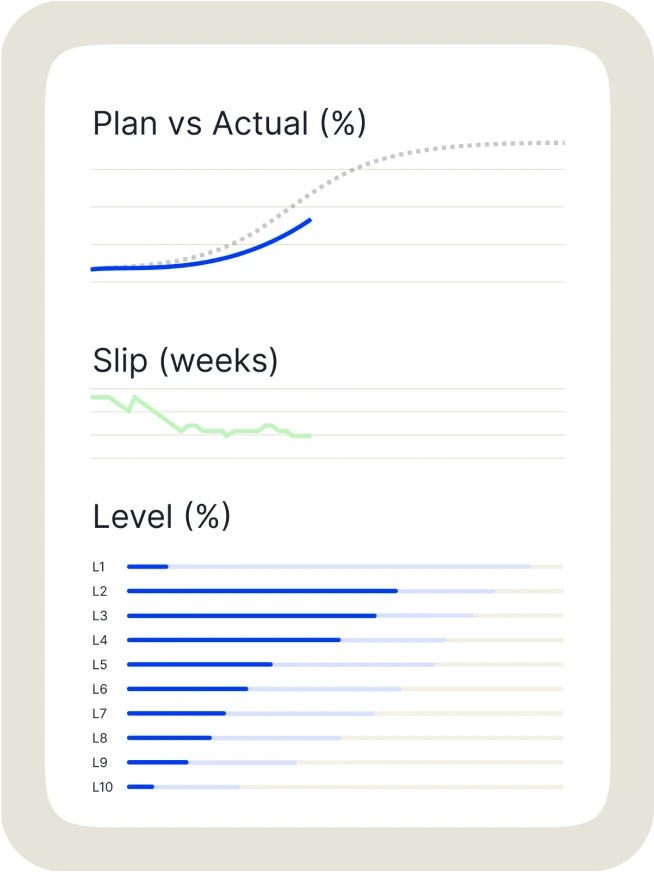
See how builders spot schedule slips earlier. Get a demo.
How much data center capacity is under construction?
North America’s eight primary markets had a record 7,481.1 MW under construction in the first half of 2026, up 24.8 percent in six months, according to CBRE’s North America Data Center Trends H1 2026. Vacancy fell to a record-low 1.4 percent, and 80.4 percent of the capacity under construction was already preleased. Net absorption reached 1,456.2 MW, with Northern Virginia leading at 467.6 MW.
JLL counts more than 66 GW under construction across all of North America, with about 77 percent of it in frontier markets outside the established hubs. The two figures differ in scope rather than conflicting: CBRE tracks eight primary markets, while JLL includes every region where new facilities are rising.
Data center capacity by region
| Region | Under construction | Source, date |
| North America, 8 primary markets | 7,481.1 MW | CBRE, H1 2026 |
| North America, all markets | >66 GW | JLL, midyear 2026 |
| EMEA | 3.8 GW | Cushman & Wakefield EMEA H1 2026 |
| APAC | 4.8 GW (26.5 GW pipeline) | Cushman & Wakefield APAC H1 2026 |
The rapid expansion reaches well beyond the U.S. Malaysia alone has 1,039 MW under construction.
How many data centers are in the U.S.?
The U.S. has 5,046 data centers listed as of November 2, 2026, according to Data Center Map’s U.S. directory. Directory counts change as operators add new facilities, so cite the date alongside the number.
Where planned data centers are going
More than 1,500 new data centers are in development across the U.S., based on a Pew Research Center analysis of Data Center Map listings. The South holds 754 planned data centers, almost half of the national total. Future expansion is also reaching new ground: 39 percent of planned sites are in counties with no data center today.
| State | Planned data centers |
| Virginia | 287 |
| Texas | 170 |
| Georgia | 141 |
| Illinois | 123 |
| Arizona | 86 |
Source: Pew Research Center analysis of Data Center Map listings, April 2026
Labor statistics for data center construction
The construction industry needs about 349,000 net new workers in 2026, according to Associated Builders and Contractors, and ABC notes that demand for electricians capable of precision wiring has surged with data center construction. Turner & Townsend’s 2026–27 index found 81 percent of respondents see skilled labor as constrained.
The shortage shows up in schedules. In the AGC 2025 Workforce Survey, 45 percent of firms reported project delays caused by worker shortages. The Bureau of Labor Statistics projects electrician employment to grow 9 percent from 2025 to 2035, with about 72,700 openings a year. Cushman & Wakefield also cites wage pressure across mechanical, electrical and plumbing trades as a driver of rising costs.
| Labor statistic | Figure | Source, date |
| Net new construction workers needed | ~349,000 in 2026 | ABC, Jan 2026 |
| Respondents reporting constrained skilled labor | 81% | Turner & Townsend, 2026–27 |
| Firms reporting delays from worker shortages | 45% | AGC, 2025 |
| Electrician employment growth | +9% (2025–2035) | BLS |
| Electrician openings per year | ~72,700 | BLS |
What the numbers mean for data center developers & builders
What builders can still control
Builders can’t set power dates or equipment lead times. They can control how fast their team finds a deviation on site. On a data center, speed matters most for MEP and fire suppression systems installed before walls and ceilings close, because a conflict found after close-in becomes rework on the critical path.
Example: Sweet Projects at Longcross
Sweet Projects, which builds advanced data centers in the UK, rolled out OpenSpace at its Longcross project and moved to daily, and sometimes twice-daily, site captures. With AI construction progress tracking, OpenSpace Track turns site captures into AI-processed, expert-verified progress reports, so data center developers and general contractors can compare planned and actual work on one site or across hyperscale campuses.
“On a data center, the expensive misses sit above the ceiling and under the floor. Think a sleeve in the wrong spot, or a fire suppression branch that clashes with cable tray. On most jobs you catch that at punch. On a data center you catch it during commissioning, with the owner counting days to energization. The teams I’ve seen handle this well document the rough-in before it closes, every overhead run and every penetration, tied to a location and a date. Then a superintendent can answer a question from the record instead of opening up a finished ceiling.”
—Wesley DuBose, Product Manager, OpenSpace
See how OpenSpace brings Visual Intelligence to data center projects for owners and general contractors.
How these data center statistics were compiled
This page includes only data center statistics that appear on a live page from the original publisher, checked on November 2, 2026. Where possible, it favors public records such as Census and BLS releases over modeled estimates. Each figure carries its publication date because data center markets move fast.
Check the scope before you cite a number:
- Capacity: CBRE covers eight primary North American markets, while JLL covers all of North America.
- Market size: FMI sizes the global market, while Census reports U.S. construction spending only.
- Cost: Cushman & Wakefield’s $17.6 million per MW and Turner & Townsend’s $12.08 per watt use different methods, so cite each on its own.
- Facility counts: Pew’s analysis of planned sites uses a filtered set of Data Center Map listings, so its counts differ from the live directory total.
Source list
| Publisher | Report | Date |
| Future Market Insights | Data Center Construction Market | Sep 2025 |
| U.S. Census Bureau | Construction Spending, Private (SA) | Oct 2026 (Aug 2026 data) |
| Cushman & Wakefield | 2026 Data Center Development Cost Guide | Sep 2026 |
| Cushman & Wakefield | EMEA and APAC Data Centre H1 2026 updates | Aug–Sep 2026 |
| Turner & Townsend | Data Centre Construction Cost Index 2026–27 | Oct 2026 |
| Turner & Townsend | Data Centre Construction Cost Index 2025–26 | Nov 2025 |
| McKinsey & Company | Scaling bigger, faster, cheaper data centers with smarter designs | Aug 2025 |
| JLL | Global Data Center Outlook | Jan 2026 |
| JLL | North America Data Center Report, Midyear 2026 | Aug 2026 |
| CBRE | North America Data Center Trends H1 2026 | Sep 2026 |
| Data Center Map | U.S. data center directory | Nov 2, 2026 |
| Pew Research Center | Most new data centers in the U.S. are coming to rural areas | Apr 2026 |
| Wood Mackenzie | Power transformer lead times | Apr 2024 |
| Associated Builders and Contractors | Workforce shortage estimate | Jan 2026 |
| AGC of America | 2025 Workforce Survey | 2025 |
| U.S. Bureau of Labor Statistics | Occupational Outlook Handbook: Electricians | 2026 |
| Lawrence Berkeley National Laboratory | 2024 U.S. Data Center Energy Usage Report | Jan 2025 |
Last updated: November 2, 2026
Frequently asked questions
Which state has the most data centers?
Virginia has the most data centers in the U.S., with 707 listed on Data Center Map as of November 2026. Texas follows with 593, then Georgia with 304.
How much electricity do U.S. data centers use?
U.S. data centers used about 4.4 percent of the country’s electricity in 2023, according to Lawrence Berkeley National Laboratory. The same report projects that share could reach 6.7 to 12 percent by 2028. Electricity consumption grew from 58 TWh in 2014 to 176 TWh in 2023.
What is the difference between hyperscale, colocation & enterprise data centers?
Hyperscale data centers are large facilities built and run by cloud and internet companies such as Microsoft to deliver their own digital services, from cloud computing to streaming platforms. Colocation data center facilities lease space and power to multiple tenants. Enterprise data centers serve a single organization’s own operations.
Are most new data centers being built in rural areas?
Yes. Pew Research Center found that 67 percent of planned U.S. data centers are in rural areas, compared with 13 percent of the data centers operating today.
Bring clarity to your next data center build. Request a demo of OpenSpace.